Trying to find the top, or find the bottom? Most traders are doing just that, but how many are actually able to do that, I’d venture to say about the same average as there are winning traders 10% or even less. There is, however, a little formula I have found over the years to at least try and help you get closer to nailing these tops and bottoms.
We all know trading is done by humans, and we all know humans do the same thing over and over again, mostly because we just can’t help it or we are to dumb to notice we are doing it. Either way, these emotions are depicted in stock charts and the pattern those charts make. I will give you some real charts with real examples and what you can look for to help with your trading, as I think everyone needs more patience anyways, looking for this pattern, may force patience on you. This will be an example of finding a bottom, just reverse it for finding a top to short.
Move #1
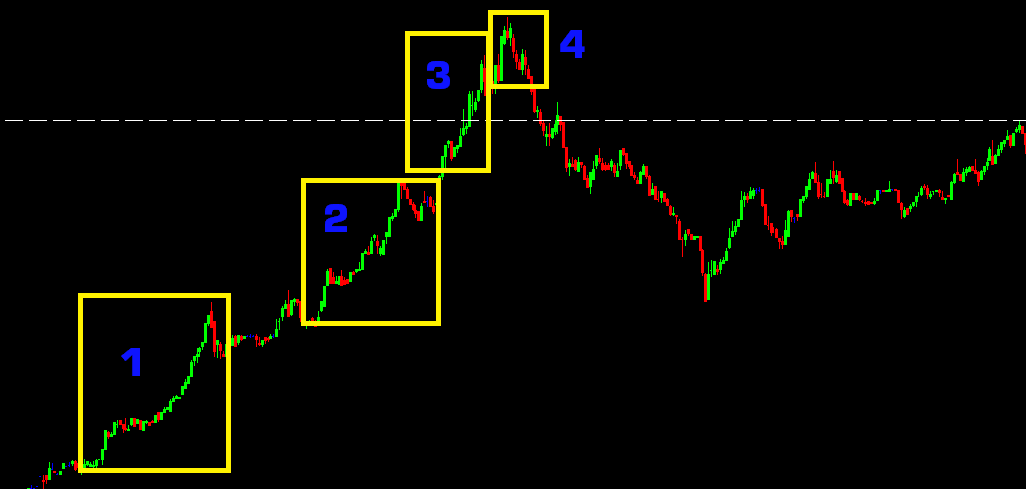
Up/Down it doesn’t really matter it will look the same either way, but the main this is the breadth of each move. This first move usually catches everyone off guard and tends to generate that “whites of thier eyes” move and is generally the biggest of the 4 part pattern. Take this FB move for example below, the first move must come after consolidation, that is key, as its going to tell you the overall direction of the next three moves.
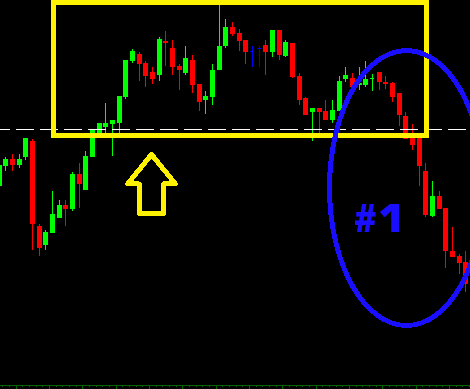
As you can see the yellow box is consolidation and once we break the move 1st move down is the “panic of profit taking” people are generally calm if up in a large long position and are ok with a pull back, you will also get some shorts added in there as well. I call this the “we are fine, it will bounce back move” Generally emotions are two sided here, longs are ok with it. However, any new short sellers are eager to get in as they now should have a set risk (the bottom of the yellow box) so they are excited.
Move #2
Now that we have an establish trend lower after the very defined lower high, the next move will have the longs feeling a little more concerned and taking profits along with the 2nd round of shorters eager to follow the downtrend. The one thing that you will want to play close attention to is the breadth of the move, this is key with the psychology of every trader involved, we know its going lower but how much lower can tell you a lot of things.
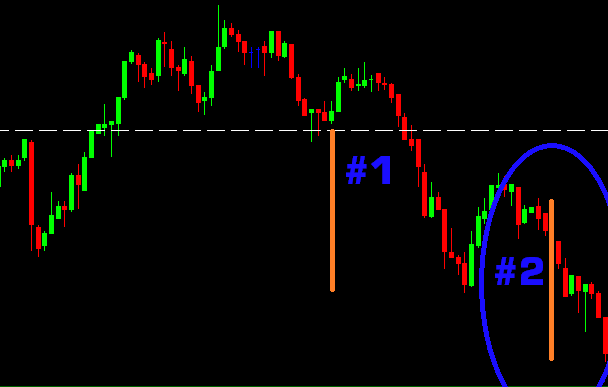
You can see two orange lines that I put on there, these both represent the breadth of the downward move from the previous resistance areas, see anything strange??? Yup, both of those lines are the exact same length from top to bottom, so the breadth of the moves are identical. What this can tell you is that, longs are now getting on their toes, and maybe eager to sell if it goes any lower, with shorts not wanting to cover to early, or the start of some greed. This move is what I call the “symbiotic relationship move” as both longs and shorts are at the exact same stage of thinking, only totally in reverse. Some interesting things can happen on the next moves, which are key.
Move #3
Now you can see something interesting on the 3rd move down, its not nearly as deep as the first two moves. I used the purple lines this time for the bounce breadth. So, the thing you should notice is that the 1st bounce was bigger followed by a 2nd bounce that was less. This does two things in traders minds, and it is quite interesting and I find the be the best part of trading. On the long side you start to get that itch of panic, and on the short side, you start to get the feeling of that BIG washout coming, or the start of true greed.
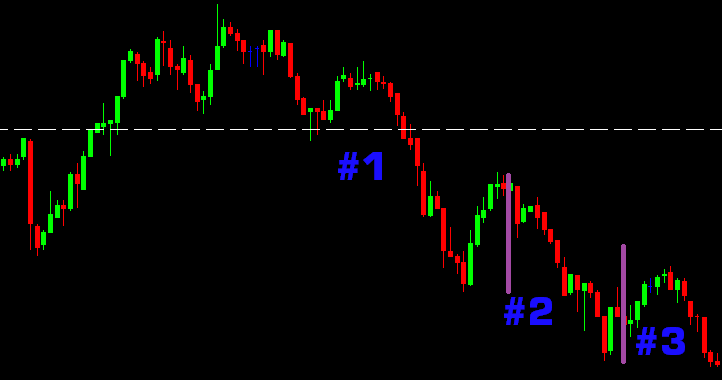
With these two emotions going, generally volume picks up and paying close attention to Level 2 is pretty key here as well, but by no means will it give you the whole story. The thing is with move three, most think this is the bottom, so you get shorts covering, and new longs trying to “catch the knife” of the trade. Both sides are generally at that turning point of. “WHAT DO I DO?? Sell, short more, cover, buy????” With this uncertainty, there is a very subtle and brief moment of lower volume, people are waiting to see what others are going to do. Tensions are high on both sides, shorts want to lock in profits and longs at this point don’t want it to go any lower or they may “panic” out. Keep in mind breadth on the next move.
Move #4
I have removed the lines on the final chart to show you and allow you to visualize it for yourself. The bounce after the downward move is two things, those knife catchers and shorts wanting to cover to lock in profits. So you get a nice fueled move to the upside, right back to the top of the channel of the last bounce. Its hard to tell for many, but you get a lot of short covers thinking that was the bottom and then longs thinking its going higher (blue arrow).
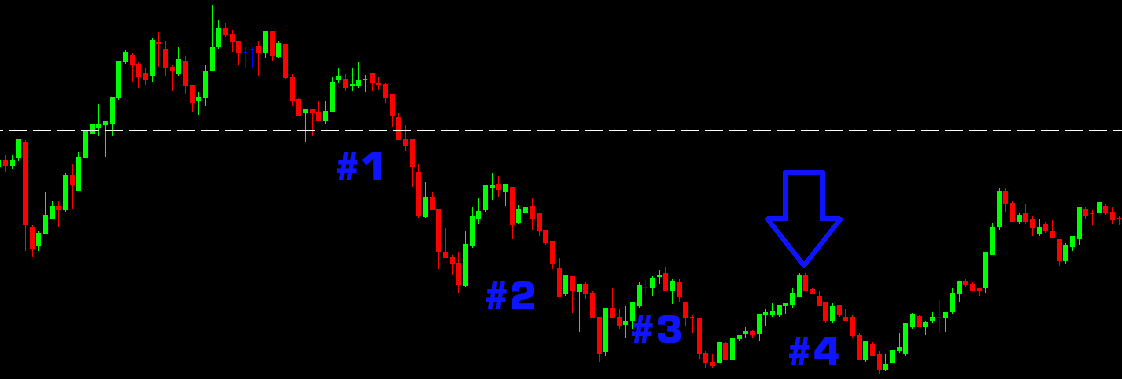
The final move lower is again generally lower volume then the rest, as you have most shorts that just “profit covered” and the new knife catching and original longs. The last move is, where I feel is the reason most traders fail, because everything is giving you the false indication of that “easy” trade. Imagine if your short here, and you held from the middle of #1 move down, you expecting a HUGE washout to cover into, because the stock look incredibly weak, so you may even add on size during #4
Now imagine if you had been long or bought the bounce on the #3 bottom move, as soon as you see it go even lower, you are thinking the same thing. This is the fun part, EVERYONE is thinking the exact same thing, therefore, you now have a crowded trade usually with some good volume. Longs are panicked out, and shorts are adding lower, I mean, the chart is so OBVIOUS here that is going lower, right!?!?!
Then as you can see, it flips over and you can see the big panic covers along with the long chasers. then it all starts over, of course you need to have some consolidation after this to have it all refresh over and over again. Hopefully this helps you in anyway, if you have some questions leave a comment or reach out. I will post some examples below of this on longer time-frames as well a recent VLTC example of how I used that emotion. Cheers.
EXAMPLES OF PATTERN IN ACTION
Less and less on the $VLTC moves down, making me bullish on dips
— OddStockTrader (@OddStockTrader) July 17, 2015
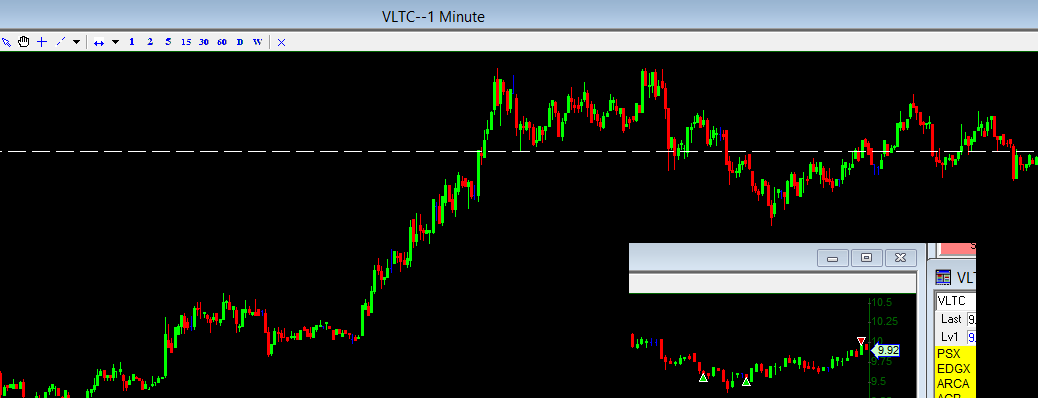
My executions for a long are in green and sold at the red, but you can see on this one that there were distinctly 4 moves down, followed be exactly the details of this post.
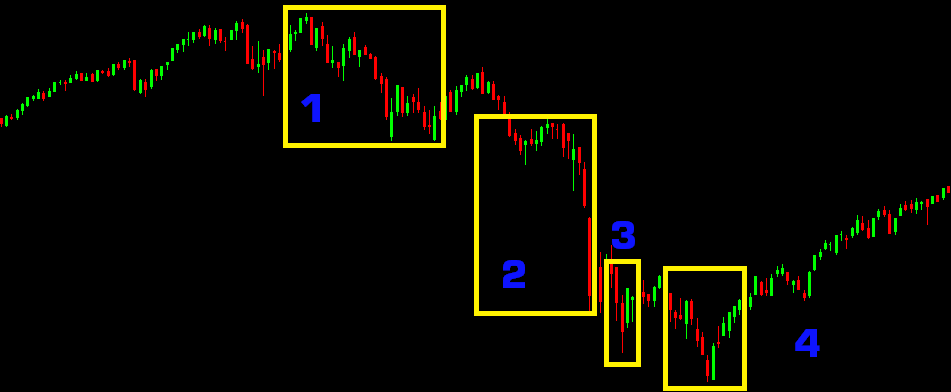
Not all charts will look the same, but this is the SPY in 08-09 and the pattern is still there, obviously when the ENTIRE world is involved in the trades, it will appear a lot different.
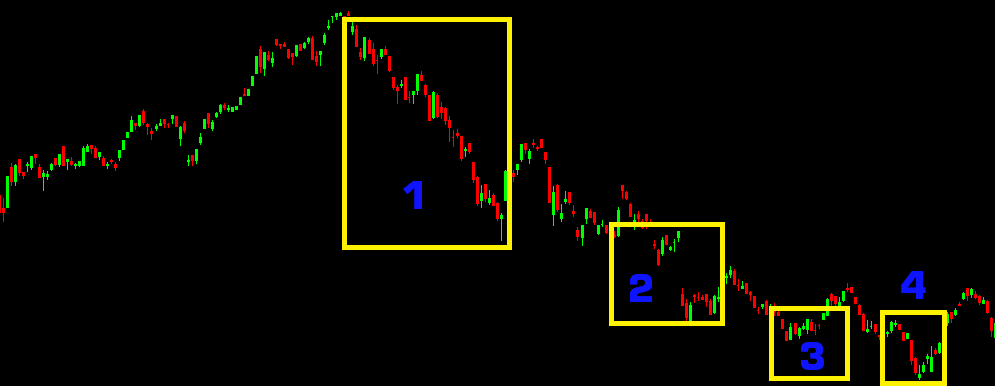
See if you can guess the last one below it was a move back in 12-13 on a big name, but yet again, same setup.
Below is ETSY intraday move, same setup again, just on the long side of the trade.