Recognizing Similar Chart Setups
Today I wanted to review SCOK chart and some of the things you should be looking for when day trading. This example has come up a few times in the last week and wanted to share with you all my observations on what I see and what you can do to profit from them as well. Last week I posted a trade review on RADA which I went over in detail on why it was a short vs. a long (even though I took the long side).
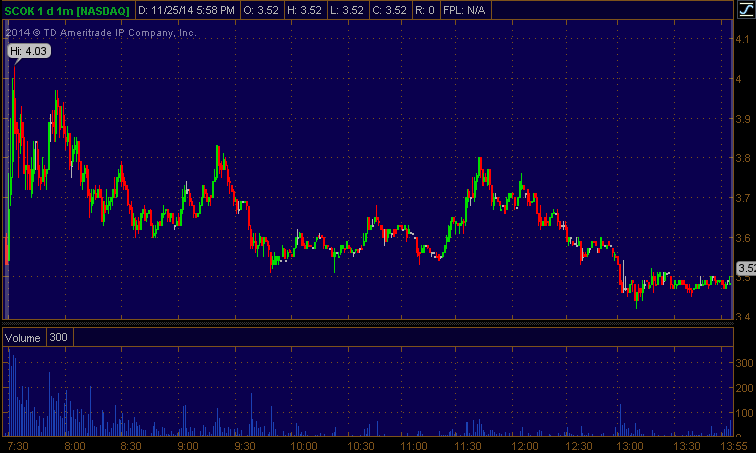
Today we had a nice gap up on some probably bogus news on this SCOK but however it creates trading opportunities, and as day traders that is all we care about. As someone said, “We trade the ticker not the company.” With this gap up you could have looked for really one thing, go long (not really something I would attempt on a gapper) or look for the parabolic short on a whole number. If you took that idea as the whole number short ($4) it would have been a great trade. But what I want to go over is the full day action on SCOK mostly around the 9:15 time (on my charts, as I live in AZ) and later in the day around 11:30.
First lets take a look at these two charts in total:
SCOK Intraday
RADA intraday
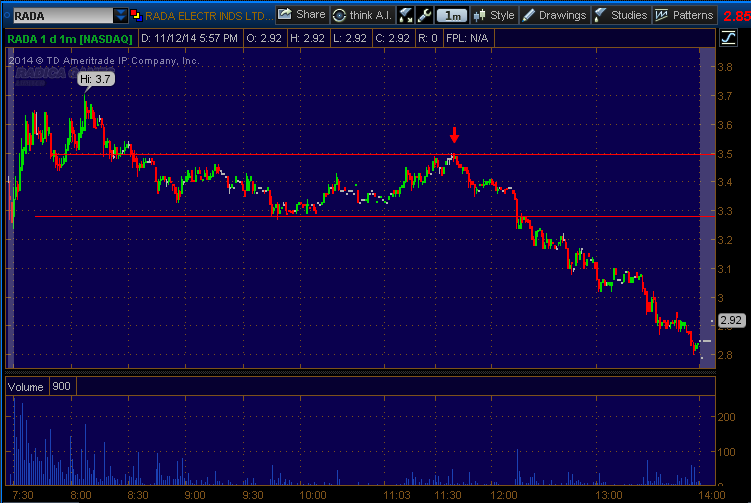
Notice something similar in these charts? I sure do! Up until about 3:30 on the chart at least they look almost like twins. Take a look at the times the chart looked bullish and about to breakout on the day, again, nearly the exact same time.around 11:30. Bullish case for both of these is on the ABCD pattern as well from the 9:30 lows to around 11:00. This wouldnt be a horrible trade either and something to look for on the long side.
Now this whole post is to recognize the chart patterns and to be able to predict what is going to happen so that you can make $$$ off it. Something that you can always fall back on when trading is, what did another stock do, and does the one i am watching today look like its doing the same. USE THAT thought process and it will make you a better trader.
Chart Stuffing
I want to go over something else that even I am working on perfecting seeing as it as happening, as it is relatively a knew concept I have learned as well. I do recommending getting This DVD to learn about chart stuffing even more. Chart stuffing, in my opinion is basically a purely emotional move created by the market makers to get traders to gut reaction people into doing exactly what they want, sell, buy or cover when they shouldn’t be.
The whole reason for this is to trick people into thinking `one thing is happening when really they are switching the cards behind their backs to take your money.
The first stuff as we can see below occurs at around 9:15 right after a very nice looking ABCD setup (which I think alot of MM’s are using to bait people as well now) for a long trade, but notice the volume bars as well with the 100k and right after that the bids pull and it basically finds no support until the 3.70 area.
SCOK Chart Stuff No. 1
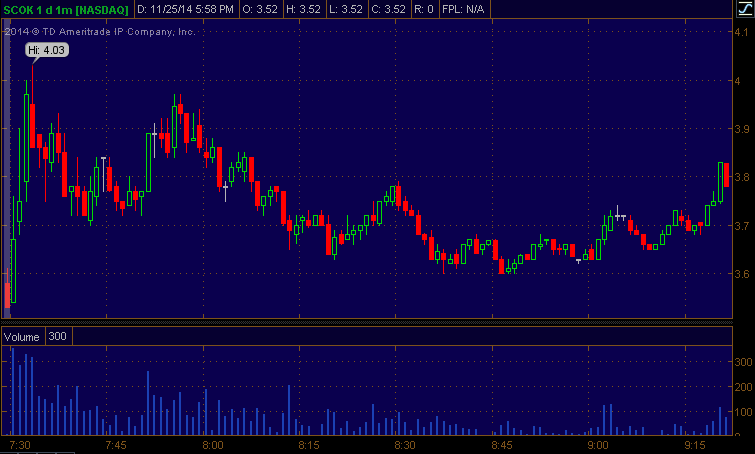
Now thinking if you are wanting to go long on that ABCD setup, you should consider two things after it breaks that 3.80 area. #1 Does it break and hold that 3.80 or #2 does it break that 3.80 and fall right back through it. If the latter occurs, you should cut and run or at least set a stop around that 3.70. There are lots of things to look for on level two, but getting the DVD will help you even more.
SCOK Chart Stuff No. 2
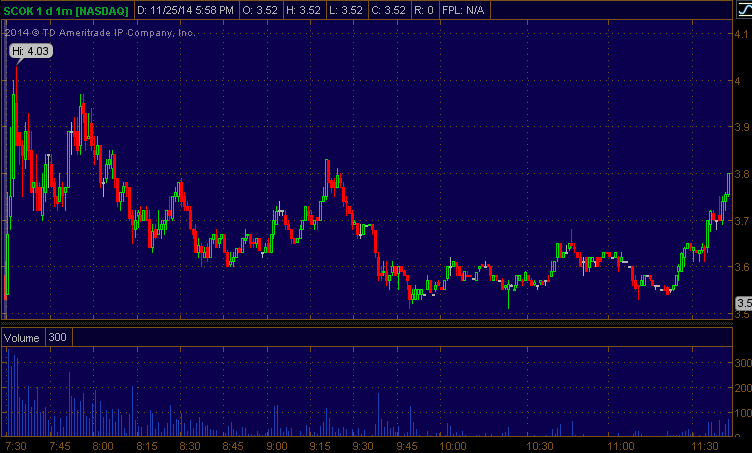
Notice something similar again with this chart vs. the one right above it? Well if you don’t, you should. ABCD setup from 9:45 to 11:15, perk then spike. But this one was different as you can tell, I even tweeted that SCOK was going to do one more stuff into the 3.70’s and this one even tricked me and almost got me to go long, again! The key here should have been the volume around 3.80s vs the prior volume on the ABCD setup (practically nothing)
With that prior top at 3.80 around 8:15 and 9:30 this would have been the near perfect Risk vs. Reward short setup, and given that this chart was similar again to RADA you could have felt very confident in the fact that they would nearly end up the same EOD (end of day).